TOOLNAVIA / BUYING GUIDE
Cloudways Slow PHP Requests: Diagnose Before Upgrading $24 Hosting
The short answer
Cloudways Standard 2GB is worth considering when you want managed PHP hosting and will use its monitoring to size a real workload. Its current reference price is **$24/month**. Before paying for a larger server, separate an expensive application request from sustained resource shortage; both can make a site feel slow.
This is a documentation-based decision guide. Toolnavia did not load-test a server, measure your site or establish a visitor-capacity guarantee.
At a glance
- Best for
- Teams diagnosing dynamic PHP workload
- Price model
- $24/month Standard2GB; $46 Standard4GB comparison
- Check first
- No measured capacity guarantee; addonsandmonitoringaccounttermsvary
Start with a slow action, not a server-wide guess
Choose a reproducible action that matters: opening an admin screen, submitting a form or running a catalog search. Record the time, URL, account state and whether the request used page cache. A quick cached homepage does not settle the performance of a dynamic task.
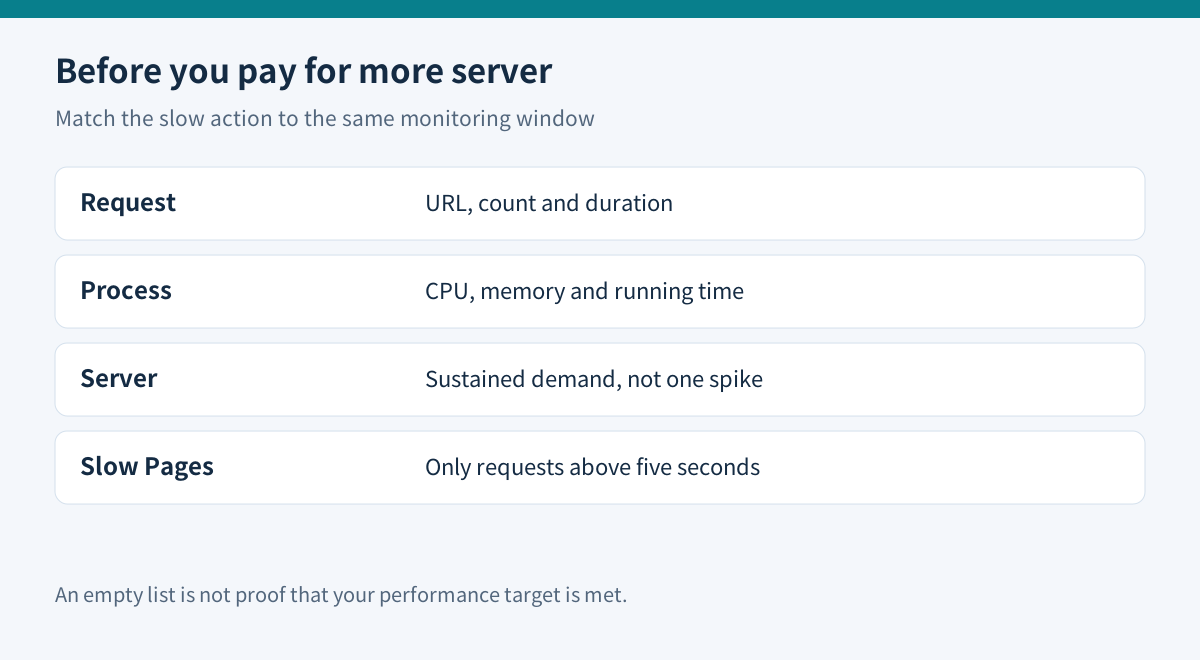
Cloudways' application PHP monitoring offers three useful views. Requested Pages combines request counts and average duration; Running Processes exposes active PHP/PHP-FPM work with CPU, memory and duration; Slow Pages lists requests exceeding five seconds, with count and timing information.
These are complementary views. A frequently called route with a moderate average can deserve attention, while an isolated slow request may be an occasional background task. An empty Slow Pages list only tells you about that view's threshold and recorded data. It does not mean every important action meets your own performance target.
Build a short incident record before changing the plan:
| Record | Why it helps | |---|---| | Exact slow action and time window | Matches a user symptom to server evidence | | Requested URL, count and duration | Separates frequent work from an unusual request | | Running process details | Shows what was active during the incident | | CPU and memory over the same period | Tests whether resource pressure coincides | | Recent code, plugin or job change | Gives a specific hypothesis to investigate |
Read the CPU graph in the correct direction
Cloudways' current CPU guide describes **CPU Consumption**: higher values mean more usage. It explicitly contrasts that with the older **Idle CPU** metric, where the interpretation is reversed. Check the label before concluding that an upgrade is needed.
Use the application breakdown to locate the busy site when several share a server. Inspect an appropriate time range instead of relying on a single snapshot. Cloudways distinguishes sustained high demand from brief spikes and suggests checking other resources as well. If the graph says no data is available, broaden the recorded period; missing measurements are not spare capacity.
A slow request with low CPU can still deserve investigation. CPU is one signal, not a complete explanation of database work, external waits or request scheduling. Conversely, consistently busy CPU during legitimate peak traffic can support a capacity review when application fixes are insufficient.
PHP worker limits are not visitor guarantees
PHP's FPM manual defines `pm.max_children` as a limit on concurrently served requests; its behavior depends on the process-manager mode. That is a configuration limit, not a promise of response time or a count of visitors a hosting plan can sustain.
As an illustration, four concurrent requests that each occupy a worker for two seconds represent roughly two completions per second under an idealized steady workload. This is arithmetic, not a Cloudways benchmark. Caching, variable request duration, databases and resource contention make real workloads different.
Increasing concurrency cannot be assumed to create more CPU or memory. Ask Cloudways support to assess the actual pool configuration alongside server resources and application timings; do not copy an arbitrary worker number from another site's setup.
WordPress' optimization handbook treats hosting resources, application configuration, plugins and caching as separate performance factors. That supports testing a suspected application cause before buying capacity. Make controlled changes on a safe copy, then compare the same action.
Use deeper traces when the dashboard leaves a question
If a transaction is slow but the cause remains unclear, tracing can reveal where its time is spent. New Relic documents examining database queries within a transaction trace, including their duration and repeated queries. It also warns indirectly through its workflow that database details depend on the trace containing that data and the relevant collection settings.
Cloudways documents a New Relic integration that takes your own license key; its current CPU guide says EU-region keys are not supported. Confirm account eligibility, collection settings and any third-party charges before relying on it. Built-in monitoring does not mean every external monitoring entitlement is bundled.
Keep the purchase decision tied to what the evidence resolves. A database-heavy trace suggests investigating that work. An application that remains resource-bound after reasonable optimization may justify a larger server. Neither finding establishes that every slow page needs the same remedy.
Price the upgrade against a defined outcome
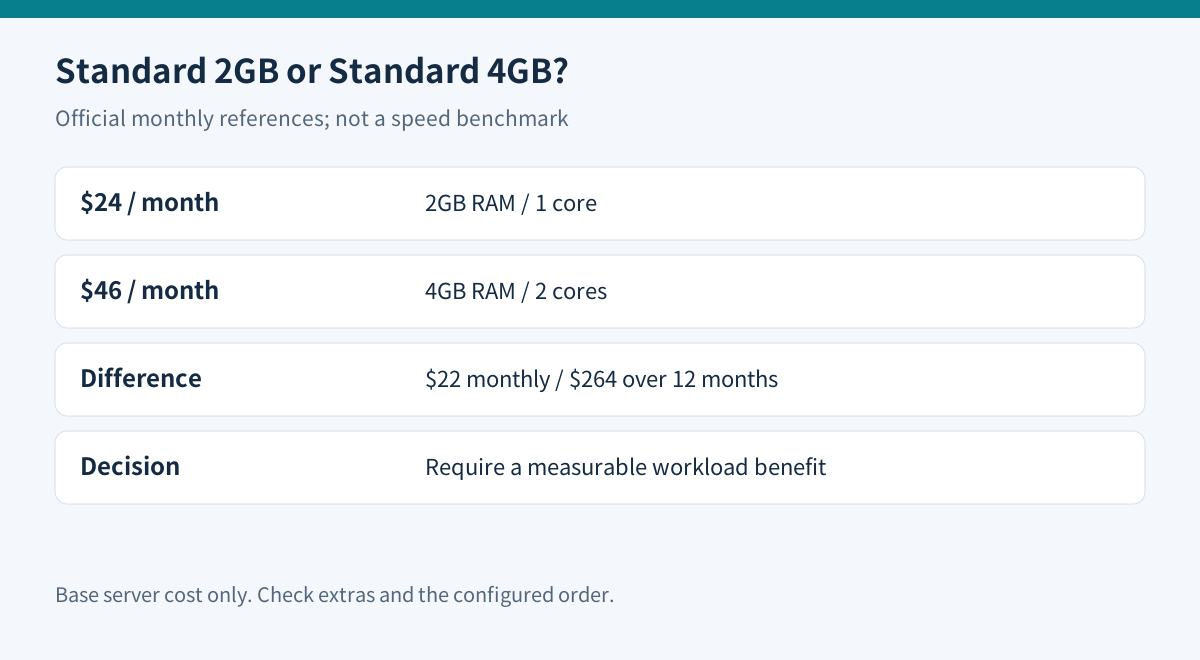
The explicit DigitalOcean Standard table lists **2GB RAM, one core, 50GB storage and 2TB bandwidth at $24/month**. Its 4GB row lists **two cores, 80GB storage and 4TB bandwidth at $46/month**. The difference is $22 monthly, or $264 over twelve full months at unchanged prices. These are base-plan comparisons, not a complete invoice or a promised speed improvement.
Before approving that increase, write a pass condition for the important action: acceptable response time, error behavior and correctness under a representative busy period. Repeat the same measurement after a controlled optimization or planned capacity change. Include backup, add-on, tax and other applicable charges from the configured order.
Keep Standard 2GB when the workload is healthy and a targeted fix resolves the symptom. Consider a larger plan when sustained resource demand coincides with slow legitimate work and the expected operational benefit justifies the cost. Defer when the only evidence is a worker-count slogan, an empty slow list or a single CPU spike.
[Inspect Cloudways' current Standard 2GB offer](https://www.cloudways.com/en/?id=2214307).
Affiliate disclosure: Toolnavia may earn a commission through this approved direct link. No measured speed, conversion uplift or guaranteed visitor capacity is claimed.